OEE & Production Performance Visibility
See what your equipment is actually producing—and what is holding it back. Connect downtime, speed, quality and production data to make better decisions on the shop floor.
Your machines are running. But how much good production are you getting?
Equipment can appear busy while downtime, reduced speed, microstops and scrap quietly consume capacity.
Overall Equipment Effectiveness (OEE) brings availability, performance and quality into one measure. Ayoka connects the production signals and operating context behind those numbers so your team can see where output is being lost—and what to work on first.
OEE = Availability × Performance × Quality. The measure becomes useful when you can see the reasons behind each loss, not just a percentage on a screen.
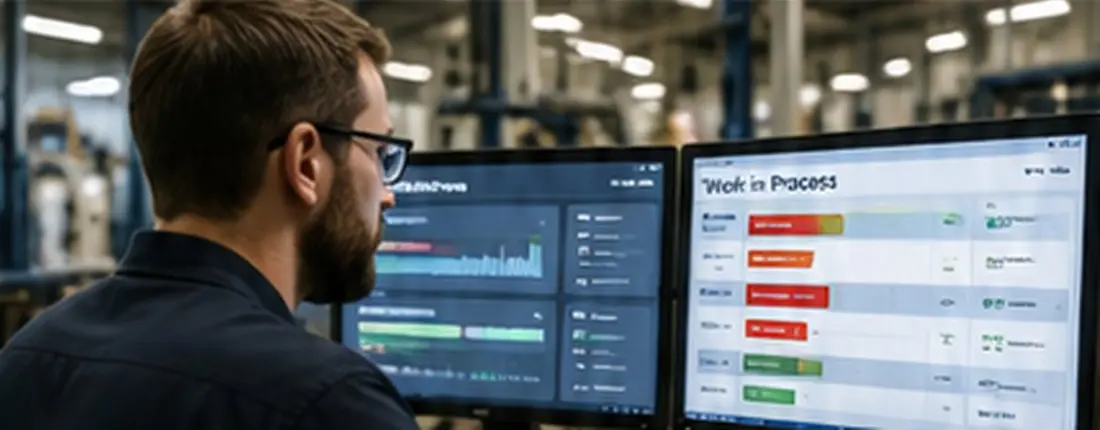
See stops, durations and recurring reasons.
Compare actual output with expected production rates.
Connect quality losses to lines, shifts and jobs.
Identify the constraint before buying equipment.
See where production time goes.
A clear operational view of OEE, machine availability, performance, quality and the events behind lost output.
OEE & Production Performance
Performance by work center
Top production losses
One score. Three different problems to solve.
Availability: When was the equipment supposed to run, and when did it actually run? Capture stops, changeovers and other planned-time losses.
Performance: When the equipment ran, did it operate at its expected rate? See slower cycles, short stops and lost throughput.
Quality: How much of the output was good the first time? Track rejects, scrap and rework that consume labor and materials.
By breaking OEE into its components, teams can focus on the real constraint rather than chase a single number.
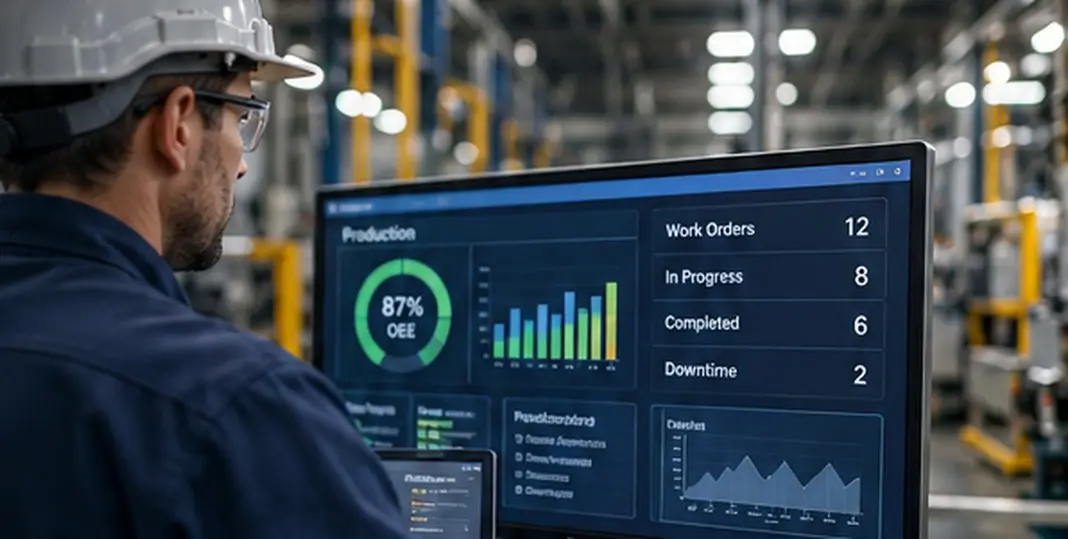
Read run states, production counts, cycle times and fault events from available equipment interfaces.
Connect work orders, shifts, planned time, reason codes and quality results.
Show trends, bottlenecks and priority improvements by line, machine and job.
Make existing systems work together.
OEE gets more useful when equipment data connects to the production schedule, work orders and the cost of lost output.
Connect machine performance to the work waiting behind it.
Lost minutes on one machine can delay downstream work centers, tie up WIP and move a promised completion date. An OEE percentage alone does not show which orders are affected.
Ayoka can connect production performance to work-order status, material availability and scheduling so managers can see not just what stopped, but what that stop means for throughput.
Explore Production Scheduling & WIP Tracking →Machine stop → Work center delay → WIP impact → Schedule decision
- Identify the affected line and production order
- See whether work is waiting upstream or downstream
- Review capacity and expected completion
- Connect lost production to labor and job-cost data
Measure what matters on your floor.
Ayoka starts by identifying the production constraint, defining planned production time and deciding which signals actually explain performance.
- Define availability, ideal cycle rates and quality counts consistently
- Connect legacy equipment where practical
- Use operator reason codes where machine data needs context
- Validate events and protect access to operational systems
- Build dashboards around the decisions supervisors make
With 24+ years connecting industrial equipment, production processes and business systems, Ayoka focuses on practical visibility using the systems you already have.
Compare equipment effectiveness across production areas.
Rent Custom Software for OEE and production visibility.
You do not have to replace your ERP or buy a rigid monitoring platform to understand your production losses. Ayoka's Rent Custom Software model provides workflows, integrations and dashboards configured around your operation for a monthly fee, at a fraction of the cost of traditional solutions.
- Built around your equipment and production definitions
- Connects to systems you already use
- Shows the losses that affect your throughput
- Can expand as your production needs change
How This Applies to Your Operation
What is OEE in manufacturing?
Overall Equipment Effectiveness (OEE) is a measure of how effectively planned production time is used. It combines availability, performance and quality.
How is OEE calculated?
OEE = Availability × Performance × Quality. Availability compares run time with planned production time; performance compares actual output rate with the ideal rate; quality measures good units as a share of total units.
What is the difference between OEE and machine utilization?
Utilization indicates how much of available time equipment is scheduled or used. OEE measures losses during planned production time, including downtime, reduced speed and rejected units.
Can OEE be tracked on older machines?
Often, yes. Depending on the equipment and available signals, production counts, run states and downtime events may be collected through PLC connections, sensors, gateways or operator input.
Does OEE require a new MES or ERP?
No. An OEE view can connect to existing PLC, SCADA, MES and business systems where suitable interfaces are available.
How do you capture downtime reasons?
Machine-state events can be paired with operator-selected reason codes and timestamps so teams can distinguish equipment faults from changeovers, material shortages and other delays.
Can we compare shifts, lines and work centers?
Yes. Consistent definitions for planned time, ideal cycle rates, good counts and downtime codes allow meaningful comparisons by shift, line, machine or product.
Can OEE connect to WIP and scheduling?
Yes. Connecting production performance with work orders and WIP helps teams see how downtime, reduced speed and scrap affect schedule commitments.
Can OEE help with job costs and margin?
Production losses can be related to labor hours, material waste and work-order costs when those systems are connected and cost rules are defined.
How does Rent Custom Software fit?
Ayoka can configure production visibility and OEE workflows around existing systems through its monthly Rent Custom Software approach.
Related Manufacturing Solutions
Connect production performance to the equipment, work orders and business systems behind it.
Where is production capacity being lost?
Tell us which machines, lines or shifts are hardest to understand. We'll start with your process and the data available today.
Start the Conversation →Not sure if your problem is big enough? That's okay.
Start with what you're seeing on the floor. You don't need a project scoped out or a technical solution figured out. Tell us what's happening and someone from our U.S.-based team will take a look.